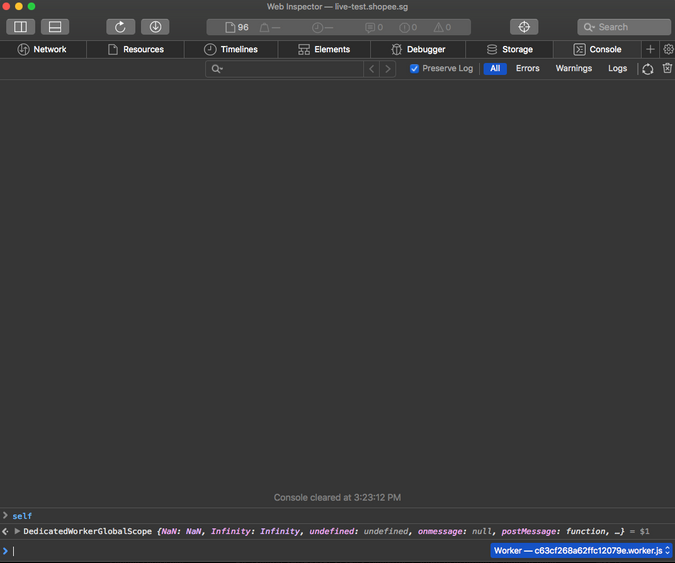
Web Workers API allows you to start a separate worker thread and receives and execute tasks off the main thread.
Since worker runs in a separate worker thread, how would you debug, ie set breakpoint, console log, and inspect your worker script?
Here's how you would do it for various major browsers:
Chrome
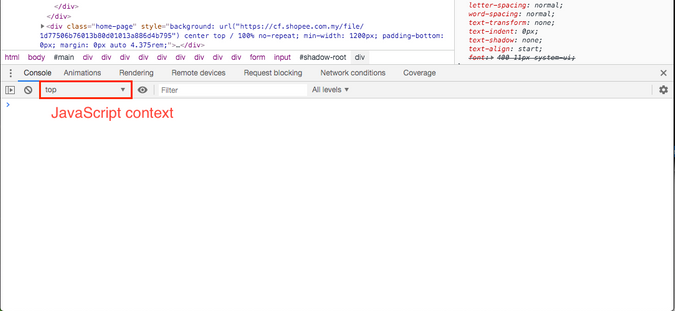
If you are debugging service worker or worker, you can head down to the console. There's a dropdown menu, if you haven't noticed previously, that says "JavaScript context".
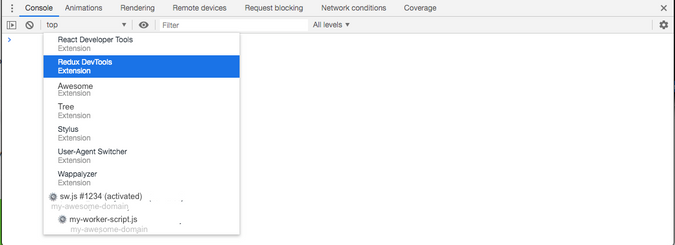
For worker context, you would see a cog logo beside the name.
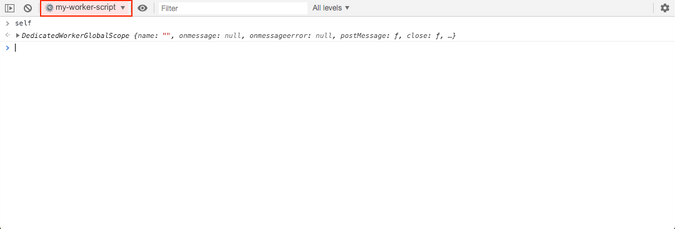
After you choose the worker context, you can type self into the console, and you should see self is an instance of DedicatedWorkerGlobalScope instead of window.
For shared worker, you would need to go to chrome://inspect/#workers. Select "Shared workers" on the left panel.
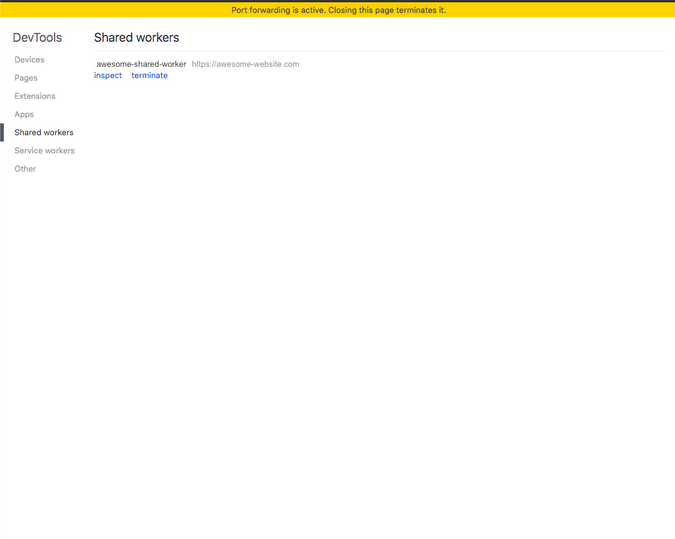
You would be able to see a list of shared workers if you have any running.
You can click "inspect", which will open a new console for you to debug.
Firefox
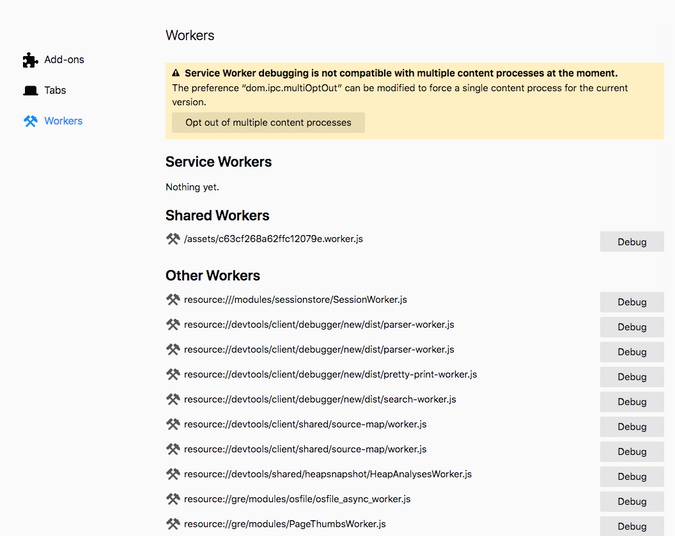
For Firefox, you could go to about:debugging#workers. You will be able to see a list of service workers, and shared workers registered to the browser.
Safari
For Safari, you could find the JavaScript context dropdown at the bottom right corner of your console.
